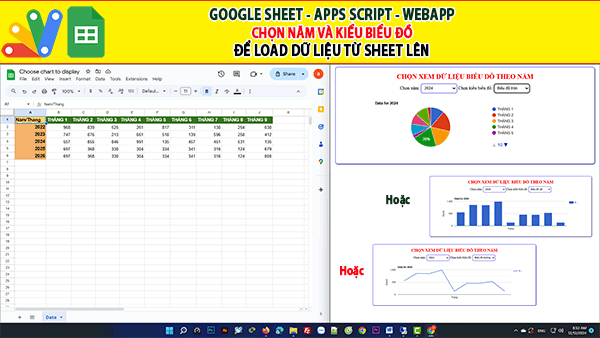
Google sheet apps script | Chọn năm và kiểu biểu đồ để Load dữ liệu lên website
Giaoan.link chia sẻ đến các bạn một project về Google sheet apps script – Chọn năm và kiểu biểu đồ để Load dữ liệu lên website. Với project này các bạn sẽ thực hiện những vấn đề sau:

- Dữ liệu được quản lý trên một sheet của spreadsheet. Dữ liệu quản lý theo năm, mỗi năm một dòng và mỗi cột là 1 tháng.
- Bạn dễ dàng thêm dữ liệu tháng là thêm một cột.
- Dữ liệu load lên webapp dạng biểu đồ, có 3 loại biểu đồ.
- Bạn chọn theo năm, chọn kiểu biểu đồ và load dữ liệu.
Dưới đây là video demo và code apps script, các project ngẫu nhiên:
- Googlesheet appscript – Hệ Thống Đăng Ký Hồ Sơ Trực Tuyến (Online Registration Portal)
- [Share Code] Biến Google Sheet thành Web App Tra Cứu Dự Án & Tài Liệu (Miễn Phí Hosting)
- Hệ Thống Quản Lý Phòng Game “Cloud-Native” với Google Apps Script
- Hệ Thống Điều Phối & Quản Lý Đội Xe Thông Minh (Web App)
- Biến Google Sheets thành Dashboard “Viễn Tưởng” phong cách Cyberpunk
- Google appscript | Hệ thống tìm thông tin và nhập liệu 2 Form-Tự động truy vấn và upload nhiều files
- Google sheet Webapp|Giáo viên chủ nhiệm quản lý điểm, thống kê xếp hạng chia sẻ cho phụ huynh
- Google sheet Webapp | Bản nâng cấp Tìm và Load Thông tin sinh viên có Hình ảnh và Bảng kết quả thi
- Google webapp | Form tìm, hiển thị kết quả học tập nhiều môn và in phiếu kết quả
- Danh mục các Bài học Google sheet Apps script Cơ bản
Code apps script trang “Code.gs”
function doGet() {
  return HtmlService.createTemplateFromFile("Index")
  .evaluate();
}

function include(filename) {
  return HtmlService.createHtmlOutputFromFile(filename)
    .getContent();
}

function getYears() {
  var sheet = SpreadsheetApp.openById('1JaRKu5r_h8D36YQeO-S73_0ltbxyoZd72WuFH__aW3U').getSheetByName('Data');
  var data = sheet.getDataRange().getValues();
  var years = [];

  for (var i = 1; i < data.length; i++) {
    if (!years.includes(data[i][0])) {
      years.push(data[i][0]);
    }
  }

  return years;
}

function getChartData(year) {
  var sheet = SpreadsheetApp.openById('1JaRKu5r_h8D36YQeO-S73_0ltbxyoZd72WuFH__aW3U').getSheetByName('Data');
  var data = sheet.getDataRange().getValues();
  var months = data[0].slice(1);
  var values = [];

  for (var i = 1; i < data.length; i++) {
    if (data[i][0] == year) {
      values = data[i].slice(1);
      break;
    }
  }

  return {months: months, values: values};
}
Code apps script trang “Index.html”
<!DOCTYPE html>
<html>
<head>
  <base target="_top">
  <script type="text/javascript" src="https://www.gstatic.com/charts/loader.js"></script>
  <script>
    google.charts.load('current', {'packages':['corechart']});

    function drawChart() {
      var year = document.getElementById('yearSelect').value;
      var chartType = document.getElementById('chartType').value;

      google.script.run.withSuccessHandler(function(data) {
        var dataTable = new google.visualization.DataTable();
        dataTable.addColumn('string', 'Month');
        dataTable.addColumn('number', 'Value');

        for (var i = 0; i < data.months.length; i++) {
          dataTable.addRow([data.months[i], data.values[i]]);
        }


var options = {
          title: 'Data for ' + year,
          width: '100%',
          height: '100%',
          chartArea: {
            width: '80%',
            height: '70%'
          },
          hAxis: {
            title: 'Tháng'
          },
          vAxis: {
            title: 'Giá trị'
          }
        };


        var chart;

        if (chartType == 'Line') {
          chart = new google.visualization.LineChart(document.getElementById('chart_div'));
        } else if (chartType == 'Column') {
          chart = new google.visualization.ColumnChart(document.getElementById('chart_div'));
        } else if (chartType == 'Pie') {
          chart = new google.visualization.PieChart(document.getElementById('chart_div'));
        }

        chart.draw(dataTable, options);
      }).getChartData(year);
    }

    function loadYears() {
      google.script.run.withSuccessHandler(function(years) {
        var select = document.getElementById('yearSelect');
        for (var i = 0; i < years.length; i++) {
          var option = document.createElement('option');
          option.value = years[i];
          option.text = years[i];
          select.add(option);
        }
      }).getYears();
    }

    window.onload = function() {
      loadYears();
    };
  </script>
  <style>
  .div-container{
    width: 900px;
    text-align: center;
    border: 1px solid blue;
    border-radius: 8px;
    box-shadow: 2px 2px 3px grey;
    margin-left: auto;
    margin-right:  auto;
    padding: 10px;
  }


   .chart-container {
      width: 100%;
      padding: 20px;
      max-width: 800px;
      margin: auto;
    }


  .title{
    text-align: center;
    font-size: 1.5em;
    font-weight: bold;
    color: red;
    padding: 10px;
  }

  select{
    border: 1px solid blue;
    border-radius: 8px;
    padding: 8px;
  }


  @media (max-width: 600px){
    .div-container {
    width: 100%;
    }
    .chart-container {
      width: 100%;
    }
  }

</style>
</head>
<body>
  <div class="div-container">
      <div class="title">CHỌN XEM DỮ LIỆU BIỂU DỒ THEO NĂM</div>
      <label for="yearSelect">Chọn năm:</label>
      <select id="yearSelect" onchange="drawChart()">
        <option value="">Chọn một năm</option>
      </select>

      <label for="chartType">Chọn kiểu biểu đồ:</label>
      <select id="chartType" onchange="drawChart()">
        <option value="Line">Biểu đồ đường</option>
        <option value="Column">Biểu đồ cột</option>
        <option value="Pie">Biểu đồ tròn</option>
      </select>
      <div class="chart-container">
        <div id="chart_div"></div>
      </div>
  </div>
</body>
</html>